
Stop Optimising ROAS. It's A Ratio, And Ratios Don't Pay Rent.
The easiest way to get a brilliant ROAS is to stop growing. Here is the number to optimise instead, and how to find your own break-even in two minutes.
I can get your ROAS to 8 by Friday.
Turn off everything aimed at people who have never heard of you. Keep only the ads shown to your email list and to people who put something in a basket yesterday. Cut the budget to almost nothing.
Your ROAS will be beautiful. Your revenue will collapse.
That is the whole problem with ROAS in one move. It is a ratio, and you can always improve a ratio by shrinking the bottom of it. Nobody has ever paid a supplier in ratios.
Why the number can't tell you what you want to know
ROAS is revenue divided by ad spend. Notice what is missing.
It does not know what your product costs you. It does not know your delivery, your processing fees, your refunds, or that a fifth of those sales were people who were going to buy anyway.
So a 3.0 ROAS is fantastic on one product and quietly ruinous on another, and the number itself cannot tell you which one you are looking at.
Sell a $100 item that costs you 20. After everything, you keep about 70. A 3.0 ROAS means you spent 33 to make 100, kept 70, and are 37 up. Excellent.
Sell a $100 item that costs you 65. After everything you keep maybe 25. Same 3.0 ROAS, same 33 spent — and you have lost $8 on every single order. Scale it and you lose faster.
Identical number. Opposite businesses. This is why "what's a good ROAS?" has no answer, and why anyone who gives you one without asking about your margins is guessing.
Your break-even ROAS, in two minutes
There is exactly one number you need, and it is personal to you.
Work out your contribution margin: for a typical order, what fraction of the money you collect survives product cost, delivery, packing and payment fees? If a $100 order leaves you $40 before advertising, your contribution margin is 40%.
Now divide 1 by that.
- 40% margin, break-even ROAS 2.5
- 30% margin, break-even ROAS 3.3
- 50% margin, break-even ROAS 2.0
- 70% margin, break-even ROAS 1.43
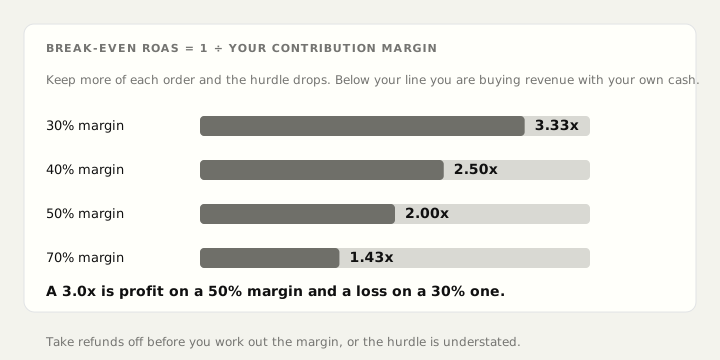
Above your number you are making money on ads. Below it you are buying revenue with your own cash.
Write yours on a sticky note. Most people running ads every day have never calculated it, which means they genuinely do not know whether the thing they do all week makes money.
Two honest adjustments. Take your refunds off the top first, or your margin is overstated by whatever comes back. And if your reporting counts organic customers as paid — which most do — your true ROAS is lower than the screen says, so leave yourself room.
Average tells you about the past. Marginal decides the future.
Here is the sharper mistake, and it is the one that costs the most.
Your account shows 3.2 overall. Above your 2.5 break-even. So you should spend more, right?
Maybe. That 3.2 is an average across everything — including retargeting people who already had your product in a basket, which might be running at 9, and cold prospecting running at 1.4.
The only question that matters when you are deciding the budget is: what does the next thousand dollars do?
Not what the last ten thousand did on average. The next thousand. And the next thousand always performs worse than the average, because platforms spend the cheap, easy money first. That is what they are built to do.
So the real ceiling on your spending is the point where the next dollar drops below break-even — and that point is always at a lower spend than your average would suggest. Average ROAS looking healthy is not evidence you can scale. It is evidence that some part of your account is doing well, and it might be the part you cannot grow.
The way to find your real ceiling is boring and it works: raise budget in steps, wait for the results to settle, and watch what the increase returned rather than what the total says. When the extra spend stops clearing your break-even, you have found your number for now.
What to optimise instead
Total contribution profit. Take everything the orders contributed after product cost, delivery, fees and refunds. Subtract all your ad spend. That is one number, it is in dollars, and it goes in the bank.
Now compare two months.
Month one: spent 5,000, ROAS 4.0, revenue 20,000. At 40% margin that contributes 8,000. Minus the 5,000 spent, you keep 3,000.
Month two: spent 20,000, ROAS 2.6, revenue 52,000. Contributes 20,800. Minus the 20,000 spent, you keep 800.
Month one wins, and it is not close, even though the second month's revenue is more than double. The ratio collapsing ate everything.
Now change one thing. Say month two's ROAS held at 3.0 instead: revenue 60,000, contributes 24,000, minus 20,000 spent, you keep 4,000. Now month two wins.
Same spend, same product, tiny difference in ratio, opposite decision. That is why you cannot judge either number alone. Only the dollars at the end answer the question.
The blended check nobody can argue with
Once a month, do this.
Total revenue from your store. Total ad spend across every platform. Divide.
That is your blended return, and its great virtue is that no setting can move it. No attribution window, no view-through, no double-counting. Money out, money in.
Watch it over months rather than days. If it holds while you scale, the scaling is real. If it falls while your platform dashboards keep smiling, your platforms are increasingly claiming customers you were getting anyway.
The one-page version
- Work out your contribution margin.
- Divide 1 by it. That is your break-even ROAS. Write it down.
- Stop asking "is my ROAS good". Ask "what did the last increase in budget actually return".
- Judge months on contribution profit in dollars, not on the ratio.
- Track blended monthly as the thing that cannot be argued with.
None of this makes your ads better. It makes you able to tell whether they are, which turns out to be the part most people are missing.
Aplon calculates contribution per order from your real costs and shows what each channel actually returned after them. Find your break-even.
Free, no account
See what your own storefront shows a shopper and Google.
Store Scan reads your public pages and tells you what is missing. Titles, descriptions, headings, image alt text and page weight. Nothing to install.
Scan my storeAplon turns your Shopify store into profit analytics. See how it works.